Tag Archive for: Urban Mobility

The gaps we need to close in our mobility strategies

By Rikesh Shah, Chair of the Transport Innovation Alliance

In May, as Chair of the Transport Innovation Alliance, it was a genuine pleasure to lead our Leadership Forum in Barcelona — bringing together 20 cities from across Europe and some of the world’s leading mobility experts for two days of open, frank discussion. A particular thanks to Manuel Valdés and the team at ATM Àrea de Barcelona for being such generous and engaged hosts. What made Barcelona particularly striking was how closely it echoed what I heard at our North American session in Detroit last month — the same questions, the same tensions, the same urgency, just in a different context. These are not local challenges; they are global ones.
Rikesh Shah in conversation with Manuel Valdés, CEO of ATM Barcelona, at the TIA Leadership Forum

The agenda was deliberately broad reflecting the myriad challenges we see in our cities everyday: cycling networks and modal shift, fleet decarbonisation, autonomous vehicles across shared, bus, and private car applications, micromobility integration, public bus efficiency, and a site visit to the Glòries interchange. Yet three themes kept resurfacing across every session, every roundtable, every case study — Net Zero, Vision Zero, and the importance of data in understanding how to reach our mobility goals. These themes pose overlapping challenges that cities cannot solve in isolation.

On Net Zero, regional and city joint strategies will remain aspirational documents unless they grapple honestly with how change happens — not just what targets to set — and look beyond the city boundary. There was an honest acknowledgement that the car will co-exist with other modes for the foreseeable future, but its footprint must shrink while investment in alternatives grows.

A related area was EV infrastructure: we are deploying heavily without the data to know whether it is going in the right places. Closing the communication gap between transport agencies, stakeholders, and industry around what Net Zero actually requires — and what interventions work — demands that different perspectives are properly heard. It is something I saw first-hand at Transport for London, navigating boroughs, suppliers, and citizens who might have different motivations so communication and relationships are key.

On Vision Zero, the consistent thread was a systems approach — safety cannot be designed in isolation from the wider urban environment. Autonomous vehicles (buses, private and shared taxis) came up several times as a case in point: the potential to reduce human error and save lives is real, but only if the risks are properly understood and mitigations rigorously managed and we saw strong arguments of how safe AVs can be. The technology’s promise cannot be allowed to run ahead of the governance. For public buses in particular, the conversation around autonomy cannot be separated from total cost of ownership — the case for deployment has to stack up financially as well as operationally, and cities need robust frameworks to evaluate that.

Placemaking is equally central to this: streets built well for people are inherently safer, more accessible, and more likely to shift travel behaviour. Living in Watford and working in London, I have seen an excellent effort for better placemaking and more space for vulnerable road users. You notice the difference straight away. Road safety is not just a traffic engineering problem; it is a question of what kind of places we want to create. And that ambition cannot rest with cities alone — regional and local plans need to reflect it jointly, because the journeys people make do not stop at administrative boundaries.

On data — the connective tissue running through both — it must serve city goals and not become an end in itself. Cities consistently tracking modal shift are seeing results; those that are not, are flying blind. And data without narrative is just numbers on a slide.

The gaps are clear. That is why the Transport Innovation Alliance is now taking three working groups forward — on Net Zero, Vision Zero, and data and policy — to turn these conversations into structured, collaborative action. We are inviting cities to express their interest in joining. The work starts here.
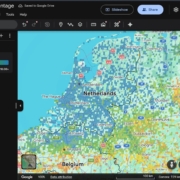


Google Earth adds global cycling data layer

Google Earth has launched a new data layer showing how much of a city’s travel is completed by bicycle, offering urban planners a new way to visualise cycling patterns at neighbourhood level.

The ‘cycling trip percentage’ layer, released in April, maps the proportion of trip segments made by bike within grid cells of roughly 20 square kilometres. The dataset, currently based on December 2025 activity, draws on aggregated Google Maps trend data and is now available globally through the platform.

The tool is designed to help planners prioritise cycling investment by making patterns more visible and intuitive. Users can overlay the cycling layer with other datasets in Google Earth, such as congestion or infrastructure, to identify where interventions may be most effective.

Sarah-Jayne Williams, Director, Global Product Partnerships – Geo – EMEA, Google Maps, told Cities Today the dataset can provide more granular insights into cycling behaviour.

Sarah-Jayne Williams, Director, Global Product Partnerships – Geo – EMEA, Google Maps

“The ‘cycling trip percentage’ data allows planners to analyse cycling use at the neighbourhood level and to compare cycling behaviour across different urban districts in their city and across the globe,” she said. “This data set can complement data that planners currently have available, like aggregated counts of cyclists on bike paths.”

The global scope of the dataset reveals patterns across different regions. While the Netherlands shows high cycling rates, cities in Japan display comparable levels for the same period. The data also highlights locations often underrepresented in traditional surveys focused on commuting, including college campuses and waterfront areas.

Examples include UC Santa Barbara, where cycling accounts for 16.7 percent of trip segments within one grid cell, compared to a lower city-wide figure captured in official statistics. In Brazil, the car-free city of Afuá records cycling shares above 60 percent.

The dataset is in its early stages, with cities still exploring how it can be applied in practice and how it may evolve over time.

“This data set has been available on Google Earth for just over a month so we are still learning about how cities might put this data to use,” Williams said. “This is the first version of this data set to be released and we welcome feedback from planners on ways we can improve it.”

AI scheduling tools tackle transit driver shortages

Transit agencies are increasingly turning to AI-driven scheduling platforms to tackle one of the sector’s biggest operational challenges–retaining bus drivers.

New digital tools allow operators to model different workforce scenarios, improve communication with drivers and reduce reliance on unscheduled overtime, issues that industry leaders say are fuelling burnout across the transit workforce.

The pressure is growing. Industry research suggests there is a global shortage of around 2.4 million transit workers, creating staffing gaps that often lead to forced overtime, fatigue and high turnover among bus drivers.

Speaking during an industry webinar hosted by Optibus, transit leaders said agencies must rethink how workforce planning is approached if they want to stabilise the profession.

Chris Pangilinan, Transit Executive & Consultant

“Bus operators are public transportation. They’re the face of the system,” said Chris Pangilinan, Transit Executive & Consultant and former Senior Vice President of Buses at New York City Transit. “They’re often the only person a passenger interacts with.”

Despite the critical role drivers play in urban mobility systems, workforce planning has historically prioritised operational efficiency over driver wellbeing.

Pangilinan said many transit agencies continue to design schedules primarily around cost and service outputs rather than workforce sustainability.

“It’s a lot of optimisation around economics,” he said. “It’s not optimisation around mental health. It’s not optimisation for job satisfaction.”

Staffing shortages, combined with unpredictable rosters and frequent overtime, have created mounting pressure on drivers across many transit systems.

According to industry discussions during the webinar, unscheduled overtime remains one of the biggest contributors to fatigue and burnout.

“Unscheduled overtime is our problem,” Pangilinan said. “It’s a symptom of a mismanaged roster and a mismanaged system.”

These pressures are prompting agencies to rethink how services are planned and how technology can help improve workforce conditions while maintaining reliable transit services.

Advanced scheduling platforms are helping transit agencies analyse operational data and test different workforce and service scenarios.

Waiching Wong, Global VP, Customer Success at Optibus, said digital planning tools allow agencies to explore multiple scheduling approaches before implementing service changes.

Waiching Wong, Global VP, Customer Success at Optibus

“What these tools do is let agencies create a lot of different scenarios,” Wong said. “You can see the trade-offs and figure out what works best for the operation.”

By modelling alternative shift patterns and operational strategies, agencies can better understand how decisions affect both service delivery and driver workloads.

The platforms can also support real-time communication with drivers and operational teams, helping agencies respond more effectively to disruptions and service changes.

While technology alone will not resolve workforce shortages, transit leaders say better planning tools can help agencies rethink long-standing operational practices.

That includes designing more predictable schedules, managing overtime more effectively and improving communication with drivers once they are on the road.

“Bus operators love their jobs,” Pangilinan said. “It’s our job as leaders to support them.”

Main image: Wellphotos | Dreamstime.com

New global index enables live transit benchmarking

A new interactive benchmarking platform has been launched, enabling transport authorities and operators to compare first-stop on-time performance across more than 1,000 locations worldwide using open data from the most recent 28-day period.

The Mosaiq Global Public Transit Index aggregates publicly available feeds into a single interface that allows side-by-side comparison between cities, regions and countries.

The platform replaces static reports with a rolling, regularly updated view of performance. Users can examine early, on-time and late running percentages and see how those metrics differ depending on local policy definitions.

Miki Szikszai (pictured), CEO, Snapper Services, told Cities Today that the initiative was developed in response to limitations in traditional benchmarking approaches and the fragmented nature of existing comparisons.

“The data that they’re working with is often really stale and it lacks context,” he said. “You can go to lots of sites and you can see a point in time where someone says, in 2024 here’s how our network performed, and that’s not really that helpful if you want to have really good context around how you’re performing, who your peers are, and how you can maybe take the next step.”

The index enables agencies to explore performance across hundreds of jurisdictions using the same underlying framework. It is intended to help leaders understand how their networks compare and identify potential peers for further analysis.

“We’re able to show data for February for close to 1,400 locations around the world, so you can explore and compare and work out actually how you’re doing, who you can learn from and what the next step might look like.”

A central feature of the platform is the visibility it gives to policy settings that shape punctuality metrics. Thresholds for early, on-time and late services differ significantly between countries and regions.

“There’s usually a window that’s used to define what is early, what is on time, what is late,” Szikszai said. “That varies around the world. Even being able to compare policy settings is really important.”

Szikszai said transport executives should begin by examining their own network before expanding outward to comparable peers. The objective is to identify systems operating under similar constraints rather than defaulting to headline international examples.

“They should look at their own city or location or country, and then they should just explore,” he said. “Start to get a sense of, actually, who might I learn from?”

He cautioned against drawing conclusions from headline performance figures without understanding structural differences.

“One of the stories I always hear is someone goes overseas and comes back saying, you should look at Tokyo, their public transport is amazing,” he commented. “But they won’t necessarily have that context of being able to even look at Tokyo and say, yes, Tokyo is amazing, but they have the narrowest on-time performance window in the world.”

The platform reflects only open data that has been published by authorities and operators. Where data is not available, the absence is visible within the summary results.

“If the train data is there, then we will be surfacing that,” he said. “If the data is not published as open data, then it will not appear at that summary level.”

In the UK, Szikszai said levels of open data maturity differ significantly between regions. Referring to London, he highlighted the gap between operational performance and publicly available datasets.

“One of the things that’s fascinating about London is it’s usually held up as a real paragon,” he added. “It does perform well, we know from closed data that we can see, but the open data is really weak. That’s because of the old iBus technology that they have there. They’ve got to do quite a bit of work on their infrastructure there to kind of lift it to the same level as other regions around the UK.”

Access to the index does not require registration and is positioned as an open resource for the sector.

“They don’t even need to log in,” he said. “This is open and free to use for everyone in terms of the index, because we think it really needs to be something that is a wide resource.”

Szikszai described the scale and openness of the dataset as distinctive in the market.

“We think this is a world first,” he added. “I don’t think there is anything anywhere that has this amount of data available for this many locations that is open and free.”

Images: Snapper Services

Boston launches Curb Lab to digitise and coordinate kerb space

Boston is deploying artificial intelligence and open data to bring real-time visibility to one of the most complex and contested parts of the street–the kerb.

The City of Boston has launched the Curb Lab, a cross-department initiative led by the Office of Emerging Technology to create and maintain a live digital understanding of parking regulations and build tools that help residents navigate them. The programme is designed to dynamically manage kerb space, reduce congestion and improve accessibility across the city.

For Michael Lawrence Evans, Director, Office of Emerging Technology, the drivers behind the initiative span multiple operational pressures.

“All of the above,” he told Cities Today, when asked what specific operational problem made the Curb Lab a priority–congestion, enforcement gaps, safety risks, or fragmented data. “Consider how often we rely on, use, or need information about a kerb where you live–the kerb is central to advancing our transportation planning challenges.”

Evans said the advent of rideshare, e-commerce delivery, more drivers in Boston than five years ago, and a continued commitment for accessibility have fundamentally changed kerb activity over the past decade. While the Curb Lab represents a new and focused solution, he stressed it builds on Boston’s historical effort to improve parking and kerb usage.

The initiative has been made possible by recent investments in the City of Boston’s technology stack. Three years ago, Boston stood up its own asset management platform, creating a live database of every sign in the city. Over the last year and a half, SMART grant funding from the US Department of Transportation enabled the city to build AI tools that leveraged that sign data to produce a digital kerb map.

“These technological developments set the stage for the Curb Lab; and create new opportunities for the City of Boston to share information, solve problems, and serve our residents,” Evans said.

The Curb Lab will convert hundreds of years of parking rules and historical information into a citywide digital map of parking regulations. With a publicly accessible database, residents will be able to quickly and reliably answer a simple question: can I park here?

Success will be measured not only by launching the platform, but by measurable improvements in accessibility and traffic flow. Evans said the team is developing new approaches to capturing metrics, many of which have never been reliably recorded before, and is exploring more privacy-preserving technologies alongside existing camera-based solutions.

“We see accessibility as a result of good kerb productivity: high occupancy rates with high turnover rates,” he said. “We want as many people to get as close to their destination as possible, but once occupancy creeps too high up and we see dwell times and dwell time violations rise, that’s when traffic becomes impacted.”

To improve traffic flow, the city will focus on behaviours known to reduce it, including cruising, double-parking events, idling minutes and lane minutes blocked, alongside measures such as traffic volumes and average signal control delay.

The initiative has also required governance changes to connect historically siloed kerb and parking systems. Boston established a Curb Coordination Committee and leveraged its open data portal to prototype and build foundational components before bringing stakeholders into later-stage discussions.

“This is where things get really exciting–and it goes well beyond the kerb,” he said. “Because kerb management is inherently multi-modal, building this foundation opens the door to thinking much more holistically about a city’s mobility challenges, including safety.”

He added that better access to kerb information could fundamentally shift how residents experience public infrastructure, moving the relationship “from anxiety and defensiveness–worrying about tickets and towing–to trust and confidence navigating public space.”

Image: Jorge Salcedo | Dreamstime.com

Former San Francisco transport strategy chief joins Cities Today Institute

The Cities Today Institute (CTI) has appointed Jonathan Rewers (pictured) as Director of Mobility for North America, strengthening its senior mobility leadership as cities across the region face mounting pressure to deliver transport reform amid rapid technological change and funding constraints.

Rewers brings nearly three decades of experience in city government, including more than 15 years at the San Francisco Municipal Transportation Agency (SFMTA), where he most recently served as Chief Strategy Officer.

In his new role, he will support agendas, provide strategic direction, and moderate the Institute’s North America mobility meetings, working closely with senior city officials and industry partners.

For Rewers, the move reflects a belief that cities need spaces where leaders can step back from day-to-day pressures and confront the scale of change reshaping urban transport, while staying focused on delivery rather than theory.

“Cities are where the world changes,” he said. “We’re in a period where cities need to be beyond the minimum expectation that the status quo is okay. The minimum expectation should be that we move at the pace of change.”

Rewers sees the Cities Today Institute as a rare forum where cities can step away from modal silos and engage in practical, cross-cutting discussions about how transport systems function.

Through closed-door meetings and peer networks, the Institute convenes senior city leaders and industry partners with a shared focus on implementation.

“When we focus on public transport alone, or safety alone, or freight alone, we end up disappointing,” Rewers said. “Everything is interconnected.”

His ambition in the role is to help city leaders not only share ideas but understand how to implement them within complex political and institutional environments.

“Every time I participated in these discussions, I walked out with a brand-new idea,” he said. “What I want to bring is not only generating those ideas but talking about how you actually achieve them.”

Learning from disruption, not resisting it

Rewers’ outlook has been shaped less by abstract strategy than by proximity to disruption. His career at SFMTA coincided with a period when San Francisco found itself repeatedly at the forefront of global mobility change, often before other cities had time to react.

“I could see the headquarters of Uber from the window of my office,” he said. “I saw what that did to the taxi industry. I saw scooters show up from nowhere. I saw micromobility show up.”

Ride-hailing platforms scaled rapidly. Dockless e-scooters appeared on pavements almost overnight. Private commuter buses, delivery services and early autonomous vehicle pilots blurred long-standing boundaries between public and private transport. The speed and visibility of change forced city officials to respond in real time, often without established playbooks.

“We were so afraid of the rapid change, we tried to slow it down to our pace,” Rewers said. “What I learned over time is that we need to join the rapid pace of change.”

That experience now underpins how he thinks about leadership in cities more broadly. While innovation is unavoidable, Rewers cautions against focusing on the new at the expense of the fundamentals.

“Sometimes we get so excited about the new that we forget about the need for strong foundations,” he said, pointing to asset management, infrastructure condition and technology ecosystems. “You let those crumble, and everything else becomes harder.”

Lessons from San Francisco’s experience

Despite San Francisco’s reputation as a testing ground for scooters, ride-hailing and autonomous vehicles, Rewers argues that its most influential contribution to urban transport thinking was less visible but more durable.

“The number one thing that came out of San Francisco in my time is variable pricing on parking and using parking management as congestion management,” he said. “Using the kerb to manage traffic, manage the movement of goods, and actually reduce congestion and speed up public transport.”

By reframing parking and kerb space as active policy tools rather than static assets, the city helped shape how transport authorities around the world now approach congestion, freight loading and bus priority.

San Francisco’s later embrace of autonomous vehicle testing also reflected lessons learned from earlier disruption.

“We learned with Uber and Lyft and scooters to have conversations with industry and the private sector,” Rewers said. “How do you create an environment where you’re a lab? That’s something cities can learn from San Francisco.”

The constraint cities struggle to break

Looking across North American cities, Rewers points to a familiar set of challenges, but argues that funding alone does not explain why progress often stalls.

“Money and public trust are definitely in the top two, and they’re connected,” he said. “When cities can’t deliver at the pace of change, disappointment grows. That disappointment reduces trust, and then the revenue you need becomes impossible to raise.”

He describes many cities as caught in a vicious circle, where limited delivery fuels scepticism, which in turn constrains the funding required to improve services.

Freight and goods movement, he argues, are an increasingly important part of that equation. Historically treated as a state or national issue, goods movement has become a city-scale challenge as on-demand delivery reshapes streets and kerbs.

“We’re used to goods being moved on freight trains and big trucks,” he said. “Now we’re having mass movement of goods in smaller vehicles at higher volume. That creates more congestion, more safety issues, and more disappointment if it’s not managed.”

Even emerging technologies such as drones, Rewers suggests, should be evaluated through the same systems lens.

“What if we said drones are a new way to manage congestion?” he said. “How do we move goods off the ground and out of our roads?”

Rikesh Shah, Global Urban Mobility Director at the Cities Today Institute, said Rewers’ appointment strengthens its North America mobility work.

“I am delighted that Jonathan will be joining our team leading our North America activity on urban mobility,” he said. “His wealth of transport and city experience will enable us to effectively identify key mobility challenges facing cities in North America, and shape opportunities through public private collaboration on how we make cities better. It’s fantastic that we can use his creativity and experience in this capacity to take forward the Institute’s activities.”

For Rewers, the motivation remains rooted in confidence in what cities can achieve when the right conversations happen.

“I’m one thousand percent confident that the ideas and actions that will come out of this work will be groundbreaking,” he said. “You’re not only going to see ideas. You’re going to see real change.”

Parking enforcement shifts towards behaviour, not tickets

Cities across North America are starting to rethink what success looks like in parking enforcement, with a growing shift away from issuing tickets and towards getting people to pay correctly in the first place.

A new survey of parking and mobility teams suggests that nearly half of cities now say their main goal is driving compliance rather than relying on penalties to correct behaviour. However, many cities still judge performance using traditional measures such as the number of citations issued.

The findings come from the 2025 Parking Compliance Trends Report, based on a survey of hundreds of city, university and private-sector parking operators across North America.

Gene Rohrwasser, CTO of Passport, said the gap between stated goals and day-to-day practice reflects how cities have historically measured parking performance.

Gene Rohrwasser, CTO of Passport

Gene Rohrwasser, CTO of Passport

“That gap exists largely because citation volume is an easy metric to track, not because it reflects the outcome cities actually want,” he told Cities Today. “Compliance is a behavioural goal, but many departments still rely on legacy KPIs built around enforcement activity rather than customer experience or voluntary adherence.”

Rather than focusing on punishment, Rohrwasser said cities that are making progress are redesigning systems around behaviour and outcomes.

“Cities that lead on compliance-first parking invest in tools that make it simple to do the right thing, with a complete and accurate view of their environment,” he said. “When paying is easy and intuitive, compliance rises naturally.”

The study shows many cities are beginning to support this approach with digital tools. Most respondents report that between 26 percent and 75 percent of parking transactions now take place via mobile payments, while more than half have moved to digital, licence plate-based permits. Mobile enforcement software was cited as having the greatest impact on operational efficiency, followed by licence plate recognition.

However, staffing shortages and public resistance were cited more frequently than technology limitations as barriers to improving compliance. Rohrwasser said leading cities are using digital systems to reduce friction for both drivers and frontline staff.

“Intelligent enforcement tools help focus limited resources on the areas that matter most, using real time guidance, in-field photo verification, and officer direction to improve accuracy and consistency,” he said. “Combined with license plate recognition, these capabilities ensure officers spend less time searching and more time enforcing where it has the greatest impact.”

Cities are also using digital tools to prevent problems before they escalate.

“Notifications, grace periods, and clear digital receipts reduce misunderstandings before they become disputes,” Rohrwasser said. “The result is a system that feels more fair and transparent to the public, while allowing smaller teams to operate more safely and effectively.”

Despite rising adoption of new tools, more than a third of cities reported no major change in enforcement strategy over the past three to five years. Rohrwasser said this often reflects a failure to rethink underlying incentives.

“Technology alone doesn’t drive transformation, intent does,” he said. “Cities that successfully move to compliance-first models start with a clear policy goal: making it easy to comply and fair when people don’t.”

Many cities expect automation and digital enforcement to expand, but disconnected data systems remain a constraint.

“When systems talk to each other, cities can measure compliance holistically and automate intelligently,” Rohrwasser said. “With clear goals and integrated data, automation becomes a tool for accountability and trust, not just efficiency.”

Main image: Andreistanescu | Dreamstime.com

Venice tests incentives to shift travel behaviour

In Venice, a new generation of mobility apps is testing whether cashback, vouchers and gamified rewards can succeed where congestion charges and visitor taxes have struggled, nudging travellers onto public transport and bicycles during peak tourism periods.

The pilots form part of the Toyota Mobility Foundation Sustainable Cities Challenge Venice, which is backing behaviour-change solutions designed to increase use of existing low- and zero-carbon transport modes. The focus is on the mainland and motorised islands, where congestion linked to tourism and daily commuting continues to place pressure on roads and public transport networks.

Rather than introducing new infrastructure or additional restrictions, the challenge centres on motivation and habit. Finalists are testing whether incentives, information and behavioural nudges can reshape everyday travel decisions and smooth crowding before it builds in the historic centre.

Rewards over restrictions

One of the finalists, Andemo, developed by Factual Consulting, combines journey planning with a cashback-style rewards system aimed at making sustainable travel more appealing.

Josep Laborda, CEO & Managing Partner at Factual Consulting, told Cities Today that the app’s strongest impact has come from reframing greener travel as something users actively benefit from.

Josep Laborda, CEO & Managing Partner at Factual Consulting

Josep Laborda, CEO & Managing Partner at Factual Consulting

“The most impactful feature has been the ability to turn sustainable travel into a rewarding experience,” Laborda said. “By combining a simple journey planner with gamified rewards based on a cashback system, we aim to make green choices the obvious ones.”

Early usage data suggests the approach is encouraging more flexible travel behaviour. Laborda said that 61 percent of active users now use the app specifically to plan trips that combine different modes of transport. Engagement with park-and-ride infrastructure is also growing, with 12 percent of active users claiming rewards for using bike parks on the mainland.

“While this doesn’t necessarily mean everyone abandoned their car overnight, it is strong evidence that when you make using a park-and-ride facility rewarding, people are more keen to engage with that infrastructure,” he said.

Nudging travel before congestion hits

Beyond encouraging modal shift, Andemo is also being positioned as a crowd-management tool.

“Our solution aims to smooth out the flow of people by offering smarter, stress-free alternatives before travellers even reach the busiest areas,” he added.

The app highlights park-and-ride hubs such as Piazzale Candiani Bike Park and uses in-app notifications linked to weather conditions or wellbeing prompts to influence travel choices. Integration of real-time bus data is planned for early 2026.

Another finalist, Bella Mossa, developed by BetterPoints, takes a similar incentives-based approach but places particular emphasis on user autonomy. Jack Windle, Chief Sustainable Transport Officer at BetterPoints and developer of Bella Mossa, told Cities Today that long-term behaviour change depends on giving users meaningful choice.

Jack Windle, Chief Sustainable Transport Officer at BetterPoints

Jack Windle, Chief Sustainable Transport Officer at BetterPoints

“The most effective reward to sustain long-term behaviour change is choice,” Windle said. “That’s why Bella Mossa rewards sustainable trips with a currency–BeiPunti–which our members can spend or donate to charity.”

Measuring behaviour change

In Venice, popular rewards have included gelato and supermarket vouchers, while experience in the UK has shown coffee vouchers to be especially effective in sustaining participation.

Windle said the flexibility of the reward system allows users to save BeiPunti for larger purchases or donate them to charities, including Amnesty International.

The company has also begun to generate tangible data for city authorities. Windle said participants have recorded 52,789 sustainable trips, covering 134,956 kilometres. Follow-up questions show that 61 percent of respondents said a recorded trip replaced a car journey, suggesting more than 32,000 avoided car trips and an estimated saving of 12 tonnes of CO₂ emissions. A time-series analysis of GPS-recorded trips showed that two thirds of drivers used their cars on fewer days per week after taking part.

For Andemo, the early signals suggest the value lies as much in mindset change as in immediate revenue impacts.

“While it is early days for tracking direct revenue, the evidence for a positive shift in mindset and experience is already strong,” Laborda said. “These numbers tell us we are successfully building a community that is ready to embrace a greener way to move around the city.”

The winners of the challenge are set to be announced by the end of May.

Main image: Bella Mossa

Transit tech lab sets priorities around infrastructure and data

New York’s Transit Tech Lab has opened applications for its 2026 cohort, centred on real-time infrastructure monitoring and data and workflow modernisation. The focus reflects growing operational pressure on transit agencies to improve visibility and productivity.

Led by the Partnership Fund for New York City alongside the Metropolitan Transportation Authority, the NYC Department of Transportation and the Port Authority of New York and New Jersey, the initiative is seeking technologies that can strengthen asset monitoring, consolidate data, and improve workforce productivity across complex transit networks.

According to Stacey Matlen, Senior Vice President of Innovation at the Partnership for New York City, the focus reflects growing concern among agencies about limited system-wide visibility across ageing infrastructure.

Stacey Matlen, Senior Vice President of Innovation at the Partnership for New York City

“Much of their infrastructure is ageing, complex, and spread across large geographies, and data about asset condition, performance, and maintenance history is often fragmented or incomplete,” she told Cities Today. “That makes it difficult to move from reactive maintenance to proactive lifecycle management.”

Now in its eighth year, the Transit Tech Lab has received more than 1,000 applications since 2018 and supported dozens of proof-of-concepts and longer-term pilots. This year’s challenges are structured around two themes: advanced infrastructure monitoring, including real-time condition tracking and safety risk detection, and data and workflow modernisation, spanning analytics, fraud detection, and workforce optimisation.

Matlen said while pressure to deliver more with constrained budgets has remained constant, agency priorities have shifted over time.

“When the Lab was launched in the aftermath of the 2017 ‘Summer of Hell,’ the focus was squarely on immediate reliability issues like signalling, track conditions, and service disruptions that riders felt every day,” she said. “Today, agencies are thinking more holistically about infrastructure visibility and asset lifecycles.”

The scope of the 2026 challenges was defined through engagement with more than 100 operational staff and senior executives across participating agencies, a process designed to surface both strategic risks and frontline realities.

“Agencies are focused on reducing operational blind spots, whether that’s through real-time infrastructure monitoring, better detection of fraud and anomalies, or tools that help a constrained workforce operate more efficiently,” Matlen said.

She added that projects are most likely to scale when outcomes are clearly defined from the outset.

“The Lab’s structured process with clear decision points and defined milestones helps agencies and companies align early on quantifiable goals and KPIs tied to demonstrating a ROI,” she said.

Applications for the 2026 Transit Tech Lab close on 27 February.

Main image: BKit1nyc | Dreamstime.com

Philadelphia unveils equity-driven Vision Zero overhaul

Philadelphia has put equity, vehicle technology and data integration at the forefront of its new Vision Zero Action Plan 2030, introducing a series of innovations that mark a shift in how the city intends to eliminate traffic deaths.

The plan debuts a new Underserved Communities metric to track racial disparities in fatalities, launches a pilot of Intelligent Speed Assistance (ISA) in the municipal fleet, and commits to delivering safety upgrades on every mile of the High Injury Network by 2030. It also updates the High Injury Network using post-pandemic crash data and sets out new efforts to link health and crash datasets to better understand injury patterns.

These measures form the backbone of the city’s latest strategy, released by the Office of Transportation and Infrastructure Systems (OTIS) and Vision Zero Philadelphia. The plan fulfils the mayor’s 2024 executive order and draws on input from nearly 3,000 residents through roundtables, surveys and market research. A mobile-optimised online version has also been published.

“This is a plan by and for the people of the City of Philadelphia,” said Cherelle Parker, Mayor of Philadelphia. “The voices of nearly 3,000 Philadelphians are reflected in this document and will help guide my administration’s work to make Philadelphia safe, clean and green with economic opportunity for all.”

Despite continued investment in safety programmes, the report notes that 2024 fatal crashes remained above pre-2020 levels. People walking, cycling, rolling or riding motorcycles–who make up fewer than 10 percent of all crashes–accounted for nearly two-thirds of fatalities. The Department of Public Health’s new equity metric shows that black and Hispanic residents experience disproportionately higher traffic-related deaths, a disparity the plan will track over time.

The updated High Injury Network, reflecting crash data from 2019 to 2023, reaffirms that 12 percent of streets account for 80 percent of serious injuries and fatalities. Residents identified speeding, running red lights and distracted driving as their top concerns, and emphasised that physical street design changes are most effective in reducing dangerous behaviours.

The plan is organised around the Safe System approach, outlining actions on safer streets and speeds, safer people, safer vehicles, data and policy. Recent progress includes expanded automated speed enforcement on major corridors, completion of the city’s fifth neighbourhood slow zone with a 20 mph (30 km/h) limit, and new pedestrian median islands on high-risk arteries.

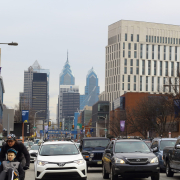
Image: Philadelpia © | Dreamstime.com